Our focus is Information Visualization
Presenting complex data in visual form breaks down the barriers between data and understanding. The advantages of visual representation include:
Improves Situational Awareness
Speeds detection of patterns in volumes of data. Innate capabilities for visual pattern detection allow people to see visual patterns they might miss in textual information.
More value from existing data
Visualizations can combine the output from disparate sensors and data sources into an easily understood picture.
Easier communication of analysis results to others in pictorial form
Particularly useful when communicating to superiors or trainees who are not experts in the analysis process.
Reduces the analyst’s mental workload
Lots of data can be presented in a visual picture, so there’s no need to sift and scroll through piles of dense data.
Facilitates training
Makes it easier for newcomers to complex fields—like cyber security—to learn how to analyze difficult data.
WhyViz – Transforming Cyber Data into Human-Centered Visualizations
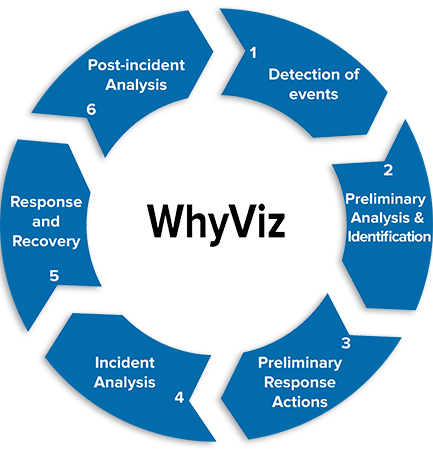 The goal of WhyViz was to conduct a study of the effectiveness of visualizations on cyber operator performance during the early stages of incident handling, which require defense analysts to review an endless alert queue of cyber event data to identify, record, and report suspicious behavior or cyber events of interest. Most cyber security visualizations are currently used for historical analyses, however, as part of the WhyViz project, Secure Decisions developed visualizations to support the real-time, in situ processing as it is actually being performed by cyber operators to facilitate event detection and preliminary event analysis.
In Phase I of this Small Business Innovation Research (SBIR), we applied knowledge elicitation (KE) methods to define specific examples of cognitive work that occur in the early stages of incident handling that have the potential for being enhanced (faster, more accurate, more complete) through the use of visualizations by the cyber operator. This cognitive work took the form of the operator seeking to answer specific analytic questions using the available data, in a severely time-constrained work environment. A KE with domain practitioners revealed that cyber operators regularly ask fundamental analytical questions that cut across specific tasks and roles. Our research identified the type of information operators need to answer these questions, the visualization concepts that represent that information in a visual form that can be rapidly comprehended and acted on, and methods to transform raw cyber sensor data into a form that can be used to populate the visualizations. In Phase II of the project (in progress) we will conduct an experiment to objectively evaluate the effects of these visualizations on operator performance.
In Phase II of the project, we conducted an experiment to objectively evaluate the effects of these visualizations on cyber defense analyst performance.
Contract No: FA8650-16-C-6711
DISTRIBUTION STATEMENT A. Approved for public release: distribution is unlimited. 88ABW Cleared 02/08/2017; 88ABW-2017-0518.
Code Pulse
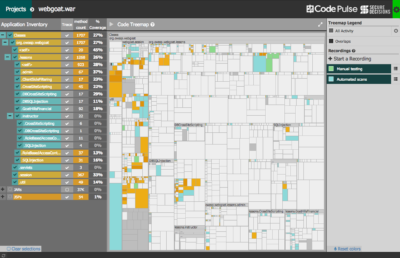 Penetration testing has proven to be a valuable preventive application security technique. A variety of automated tools and manual approaches are used to assess and expose vulnerabilities in target applications. By definition, black box testing offers little insight into the internals of target applications. Therefore, understanding the code coverage and testing overlap, or perhaps more importantly the coverage boundaries, has often been difficult to ascertain. Secure Decisions has built a free open source tool, Code Pulse, to help overcome these challenges. Code Pulse is a visualization-centric tool that provides insight into the real-time code coverage of black box testing activities. It is a desktop application that runs on most major platforms. Code Pulse is an OWASP project. For more information, please visit the Code Pulse OWASP Project page.
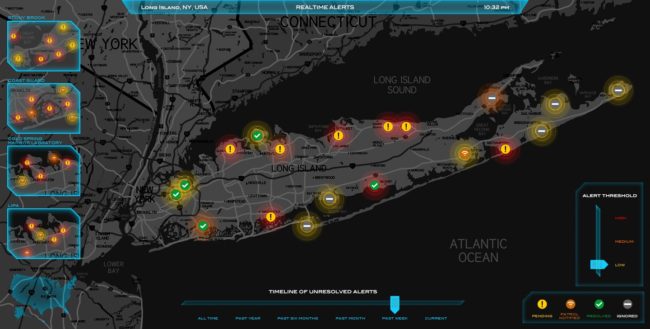
MeerCAT®
 Wireless Security Visual Analytics
 Wireless Security Visual Analytics
MeerCAT is a visual analytics tool designed to help users locate wireless assets and networks, and assess the risks to their organization. Initially developed for and in close collaboration with the U.S. Department of Defense under a DARPA Small Business Innovation Research (SBIR) program, MeerCAT integrates data from wireless discovery and other security applications with a geographic information system (GIS) to provide a unified view of detected wireless devices, their vulnerabilities and threats.
By visualizing wireless security information, MeerCAT makes it easier for users to visually correlate large volumes of wireless data and see the wireless threats hidden in the haystack of data. MeerCAT simplifies the analysis of wireless data for security and network professionals, and makes the information more accessible for those less skilled. The result is improved efficiency and accuracy in managing wireless security risks, reducing overall costs.
After the initial research was completed, the technology was successfully transitioned and commercialized as MeerCAT-Pro, and was also distributed as a government off-the-shelf product, MeerCAT-FS, which was then incorporated into the Flying Squirrel wireless discovery suite. Because of the successful research and commercialization, DARPA recognized MeerCAT as one of its success stories.
WildCAT™
Wireless Threat Visual Analytics
Critical infrastructures can be vulnerable to cyber attacks through 802.11 wireless networks. WildCAT is a prototype system that enables integration of physical and cyber security resources in order to detect and immediately respond to wireless threats. It is designed to use physical security vehicles as a platform to collect wireless activity and send the data via a cellular network to an analysis center.
VIAssist™
 Network Defense Visualization
 Network Defense Visualization
VIAssist is a visual analysis platform to help network security analysts protect their networks. It was designed after a comprehensive cognitive task analysis of network defenders. It provides visual tools for the evaluation of network flow and security data. VIAssist presents multiple, coordinated views – highlighted or filtered data in one view is reflected in all other views – to provide different visual perspectives of the data. These views transform network data into a collection of interactive visualizations that make it easier to analyze data, to see patterns and trends, and to identify risks and actionable information.