The Defense Advanced Research Projects Agency (DARPA) has created a Cyber Defense Program, responsible for developing the core computing and networking technologies required to protect DoD’s information, information infrastructure, and mission-critical information systems.
The Cyber Defense Program is developing network traffic monitoring techniques with performance and scalability orders of magnitude better than conventional approaches.
The focus of DARPA’s Scalable Network Monitoring (SNM) program is the development and testing of gateway malicious activity detection devices. Secure Decisions has teamed with Johns Hopkins University Applied Physics Lab (JHU/APL) to design, develop, and operate a cyber test environment, that provides the capability to generate a sufficient volume of both benign and malicious activity to maintain full-line speed (from 1 Gbps to 100 Gbps) at the network gateway.
Network engineers and analysts built a test network environment simulating a secure DoD network gateway and also designed test procedures, program metrics, and a corpus of malicious activity for use within the test environment. Through execution of a series of test scenarios, scoring of those results, and analysis of the performance of the systems under test, the SNM program will provide innovative network defense capabilities for the nation.
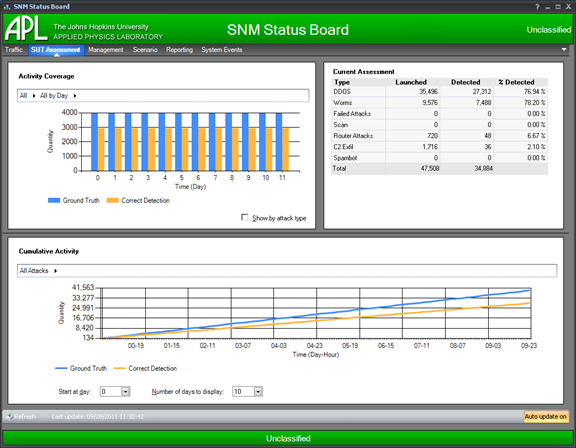
Secure Decisions has built an SNM Status Board System for monitoring test execution. This system provides the ability to monitor the test network and display the performance of systems under test. The Status Board console is a Graphical User Interface consisting of six different information monitoring and management panels:

Traffic Panel
- Shows the quantity of throughput flowing through both the high bandwidth switches in both directions, for a total of four charts.

SUT Assessment Panel
- Displays the latest test results. It consists of three different regions: Activity Coverage, Cumulative Activity, and Current Assessment. The Activity Coverage and Cumulative Activity areas are both interactive charts, providing the user the ability to drill down or aggregate data of particular interest
Other panels include:
Management Panel
- Provides the ability to monitor switch status, manage switch state, configure switch monitoring polling intervals, and manage and refresh data.
Scenario Panel
- Allows the user the ability to add, modify, and delete scenarios related to a test event.
Reporting Panel
- Generates reports from test event data that support traffic measurements and SUT assessments.
Systems Event Panel
- Displays information related to the internal operation of the Status Board system.

